
Last Updated on October 22, 2024
The Google Search Console UI dashboard and Google Search Console API have notable similarities and differences with Google BigQuery’s Google Search Console data storage and access, including data granularity, data retention, data types and metrics, query flexibility, integration capabilities, and data processing options. Understanding these differences is essential for leveraging the strengths of each platform to meet specific analytical and reporting needs.
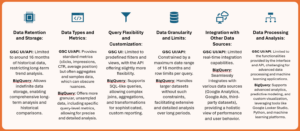
Figure 1 – Quick Comparison View of Google Search Console UI/API Data to Google BigQuery GSC Data
Google Search Console UI
The Google Search Console (GSC) User Interface (UI) dashboard is designed for immediate visualization of key search performance data trends, offering users a quick and intuitive way to access essential metrics such as clicks, impressions, click-through rates (CTR), and average position. The dashboard presents this information through filtered graphs and tables, allowing users to easily identify general patterns and trends in their website’s search performance over time.
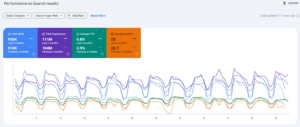
Figure 2 – Google Search Console dashboard for Performance on Search results, showing Total clicks alongside other metrics of Average position, Total impressions, and Average CTR, and with the date range comparison feature.
GSC UI users can customize their view to focus on specific performance aspects of their data using comparison features, such as comparing different time periods or URLs. This functionality helps identify seasonal trends, the impact of specific SEO efforts, and underlying query differentiation between different URLs, allowing users to analyze how search visibility and traffic fluctuate across their site. Figure 2 above shows a date range comparison of ‘Last 3 months’ and ‘Previous 3 months.’
These filters, however, are limited. For example, while there can be comparison of two time periods or two different URLs, this does not extend to more than two per each dimension. While the dashboard is helpful in what it does offer, it’s only a fraction of what can possibly be queried.
While the GSC UI is optimized for visual analysis and quick insights, the accompanying GSC API complements it by providing programmatic access to the same data. This enables more automated and scalable data retrieval, though the visualization aspect is left to the user or any integrated systems. One of the most common ways to access the GSC API is through the popular Screaming Frog tool.
Google Search Console API
The Screaming Frog GSC Application Programming Interface (API) configuration dashboard is tailored for integration with Google Search Console data, enabling users to pull essential metrics directly into the Screaming Frog SEO Spider tool. This dashboard prompts users to configure and authenticate their GSC account, select specific properties, and customize the data extraction process. Providing options like filtering by date range, device type, and query for data retrieval. Figure 3 below shows the Screaming Frog Google Search Console configuration view.
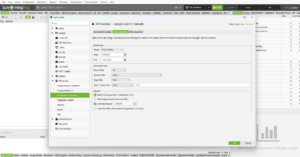
Figure 3 – Screaming Frog Google Search Console API configuration dashboard.
The Google Search Console configuration dashboard provides a range of options for authenticating and customizing data retrieval:
Authentication: Users can securely connect their GSC account using OAuth 2.0, ensuring that only authorized access is granted to their search performance data.
Property Selection: The API allows users to select specific properties (websites or apps) registered in their GSC account, enabling focused data retrieval for individual sites or apps of interest.
Data Customization: Users can tailor their data extraction process through various parameters. They can specify custom time periods for data retrieval, ranging from single days to multiple months, within the 16-month data retention limit. Additionally, users can choose from available dimensions such as query, page, country, device, and search appearance to segment the data. They can also select from clicks, impressions, CTR, and position metrics to retrieve specific performance indicators.
Filtering Options: The API supports advanced filtering capabilities, allowing users to filter by device type (desktop, mobile, tablet), by specific queries or groups of queries, by page URLs or patterns, and apply country or region filters.
Data Limits: Users can set row limits and configure data sampling preferences to manage large datasets effectively.
API Quotas: The configuration interface provides information on API usage quotas and limits to help users optimize their data retrieval strategies.
This comprehensive set of configuration options in the GSC API allows for customized data extraction, enabling users to integrate GSC data into their own analytical workflows and tools, but there are still major limitations in the way data can be accessed and queried. We find a more robust solution to this in Google BigQuery.
Google BigQuery SQL Interface
In contrast to the GSC UI and API, Google BigQuery offers a more robust and scalable solution for storing, querying, and analyzing extensive GSC datasets over longer periods of time. Figure 4 below displays an example query in BigQuery’s SQL interface, illustrating how individual combinations of query-page level metrics for every stored date can be accessed. This level of detail for Query Page Clicks, Query Page Impressions, Query Page CTR, and Query Page Average Position is discussed in more detail in other FindLaw white papers.
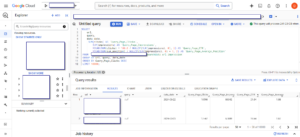
Figure 4 – Google BigQuery SQL interface dashboard.
The GSC interface and API are governed by a data retention policy set by Google, which typically limits historical data access to around 16 months. As a result, any data older than this period is not available for analysis through the GSC UI or API. This limitation can be a significant drawback for users needing to perform long-term trend analysis or historical comparisons.
BigQuery, however, allows for indefinite data storage, provided you manage the associated storage and costs. This capability extends data retention beyond the standard Google Search Console period, enabling users to perform long-term trend analysis and historical comparisons. Indefinite data storage in BigQuery is especially advantageous for businesses that depend on extensive historical data to inform their strategies and track performance over time.
While data retention policies significantly impact the scope of analysis, the types of metrics and the level of detail available are equally crucial in understanding search performance.
Google Search Console UI/API vs Google BigQuery GSC Data Types and Metrics
The GSC UI and API provide standard metrics such as clicks, impressions, click-through rate (CTR), and average position. However, these metrics are often aggregated and subject to sampling, which can limit the precision and detail available for analysis. This aggregation can obscure important nuances in the data, making it challenging to gain a comprehensive understanding of search performance. For example, low-traffic webpages, especially on a large website, may experience data sampling at a rate high enough to result in zero clicks and zero impressions being logged in the GSC UI and API, while BigQuery will hold their true traffic values.
Data exported to BigQuery can include more detailed metrics and dimensions, such as specific query-level data. This allows for a more comprehensive and unsampled analysis, providing a clearer and more detailed picture of search performance. The granularity of data available in BigQuery, combined with the absence of data sampling, enables more precise and targeted analysis, leading to more actionable insights and informed decision-making.
Having established the differences in data types and metrics, it is also essential to consider the flexibility each platform offers in querying and customizing data for deeper analysis.
Google Search Console UI/API vs Google BigQuery GSC Query Flexibility and Customization
The GSC interface offers a limited set of predefined filters and views, which can constrain the scope of analysis that users can perform. While the API provides more flexibility compared to the UI, it still imposes certain constraints on query complexity and dataset size. These limitations can hinder the ability to perform highly customized and complex reporting, which may be necessary for in-depth analysis.
In contrast, BigQuery supports SQL-like queries, enabling users to perform complex joins, aggregations, and transformations across large datasets. This flexibility allows for sophisticated analysis and custom reporting tailored to specific business needs and research. The ability to craft detailed queries in BigQuery empowers users to uncover deeper insights and create nuanced reports, enhancing the value of data analysis. This capability is further extended by the use of PL/SQL and machine learning modeling.
While query flexibility is a significant factor, the granularity of data and the limits imposed on data analysis can further influence the effectiveness of each platform.
Google Search Console UI/API vs Google BigQuery GSC Data Granularity and Limits
The GSC UI and API typically have a maximum date range of 16 months for historical data, limiting users to analyzing search performance data within this timeframe. Additionally, the API often imposes a limit on the number of rows returned per query, such as a maximum of 1,000 rows. These restrictions can constrain the depth of analysis that can be performed directly through the GSC interface or API, making it challenging to conduct detailed and comprehensive examinations of large datasets.
In contrast, when you export GSC data to BigQuery, you can store and query much larger datasets without being constrained by the same row limits. This capability enables more extensive and detailed analysis over longer periods, including data pulls in the millions of rows. BigQuery’s capacity to handle larger volumes of data facilitates deeper insights and more robust trend analysis, making it a powerful tool for long-term data processing and strategic decision-making.
To further illustrate these points, let’s examine a case study comparing data retrieval through the Screaming Frog GSC API with data queried from Google BigQuery.
Screaming Frog GSC API vs BigQuery GSC Data Case Study
Table 1 below presents a case study comparing real GSC data pulled through Screaming Frog’s GSC API with the same data, for the same URLs and date range, queried from Google BigQuery. This comparison was conducted over two periods: a short period of 45 days and a longer period of 9 months. The results indicate that the Screaming Frog GSC API retrieved 92.8% of Google search clicks and only 81.8% of Google search impressions, compared to what Google BigQuery was able to query. For the 9-month period, similar results were observed, with only 78.3% of Google search clicks and 81.8% of Google search impressions.
The same loss of data points occurred exactly in the GSC UI as found in this Screaming Frog API data pull, indicating the data sampling was present regardless of access method to the Google Search Console dashboard.
| Time Period | Screaming Frog GSC API Clicks | Big Query GSC API Clicks | GSC UI/API Clicks Data Sampling % | Screaming Frog GSC API Impressions | Big Query GSC API Impressions | GSC UI/API Impressions Data Sampling % |
|---|---|---|---|---|---|---|
| 45 Day Time Period | 1,426,379 | 1,536,539 | 92.8% | 92,868,644 | 113,501,523 | 81.8% |
| 9 Months Time Period | 7,868,147 | 8,606,854 | 91.4% | 475,904,521 | 607,508,078 | 78.3% |
Graph 1 below shows that while data sampling occurs during the Screaming Frog GSC API data pull, the trend still closely matches the full dataset found in Google BigQuery.
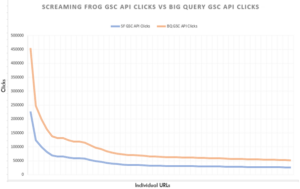
Figure 5 – Screaming Frog GSC API vs BigQuery GSC Clicks for High Traffic URLs
This is not the case for the data sampling of lower traffic webpages. While Graph 1 shows a well-matched trendline for higher traffic webpages, Graph 2 below demonstrates a complete loss of collected clicks and impressions metrics for lower traffic pages.
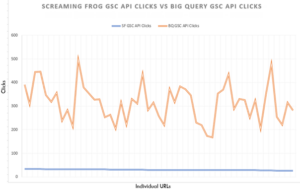
Fig 6 – Screaming Frog GSC API vs BigQuery GSC Clicks for Low Traffic URLs
This creates a false impression that these specific URLs are not receiving any visibility or traffic in search. Strategists and business leaders might wrongly assume that these are ‘0 clicks / 0 impressions’ webpages, which can lead to wasted time and resources investigating potential technical errors or performance issues. In reality, these webpages do have search impressions and clicks.
Google Search Console UI/API vs Google BigQuery GSC Integration with Other Data Sources
Integration capabilities within the GSC UI and API are somewhat limited to what the API can pull in real-time. This can restrict the ability to combine GSC data with other relevant data sources, potentially limiting the comprehensiveness of the analysis. The lack of seamless integration can be a barrier for businesses that require a holistic view of their data across multiple platforms.
BigQuery, on the other hand, allows seamless integration with other data sources, such as Google Analytics, Google Ads data, and third-party datasets. This facilitates a more holistic view of performance and user behavior, enabling comprehensive and multi-faceted analysis. The ability to integrate data from various sources in BigQuery provides a richer context for understanding search performance and enhances the capacity to make data-driven decisions.
Google Search Console UI/API vs Google BigQuery GSC Data Processing and Analysis
The GSC UI and API are limited to the functionalities provided by the interface and API, which can make advanced data processing and machine learning applications challenging. These constraints on data processing capabilities can limit the scope of analysis and the ability to apply advanced analytical techniques to the data.
In contrast, BigQuery supports integration with various data processing tools and platforms, including Google Data Studio, Tableau, R, Python, and machine learning tools. This enables advanced analytics, predictive modeling, and custom visualization, significantly enhancing the depth and breadth of analysis. The advanced data processing and analysis capabilities of BigQuery empower users to leverage cutting-edge techniques and tools to extract maximum value from their data.
While the comparison between Google Search Console UI/API and Google BigQuery reveals distinct advantages and limitations for each platform, new features and improvements are regularly made for all platforms. Future versions may help to overcome current limitations or lack of tools in all platforms.
About the Author: Daniel James Stoker is a member of the FindLaw Performance Team and holds degrees of B.S. in Physics, B.S.H.S. in Physiological Sciences, a M.S. in Computer Sciences Database Technologies, and has completed a PGP in Artificial Intelligence and Machine Learning: Business Applications.